THE U.S. HEADLINE IS AN AVERAGE.
#0
The U.S. headline is an average. Legal is lowest as a first-generation bloc. Illegal is middle, still below native average in Texas/Cato rates. Native-born average is pulled up by U.S. Black homicide. Second generation often rises. Origin is not interchangeable. Europe is a different mix. Rates not slogans.
The plate decomposes the average.
SteelMan: Averages conceal subgroup differences.
Cut: The plate does not open the Texas or Cato tables.
WHAT THE BETTER U.S. TABLES ACTUALLY SHOW.
#1
Texas homicide convictions 2013–22: legal 1.2 per 100k, illegal 2.2 per 100k, native 3.0 per 100k. Legal < illegal < native average. Still an average. Cato ACS 2024 ages 18–54. Texas DPS status link. Incarceration is not all crime.
The plate cites the rates and the sources.
SteelMan: Named state tables with status linkage are stronger than national slogans.
Cut: The plate does not reproduce the tables or the age controls.
HOW THE SLOGAN FLATTENS.
#2
‘Immigrants commit less crime than the native-born.’ One sentence. Six different tables: legal, illegal, first generation, second generation, and others.
The plate says the slogan collapses six tables.
SteelMan: A single sentence cannot carry six distinct comparisons.
Cut: The plate does not show the six tables.
IMMIGRANT IS THREE DIFFERENT POPULATIONS.
#3
Legal residents (screened, background check, work or study verification), illegal residents (not screened, no identity vetting), and asylum claimants (claims-based screening that varies). Not the 1990s. Average them and the sentence fails.
The plate separates the three screening regimes.
SteelMan: Screening differences can produce different offense profiles.
Cut: The plate does not show the offense profiles.
LEGAL AND ILLEGAL ARE NOT INTERCHANGEABLE.
#4
Illegal is still below native average in these U.S. rate studies. Cato ACS 2024 ages 18–54. Status is the column.
The plate says status must be the column.
SteelMan: Status-linked tables exist for some states.
Cut: The plate does not show the national picture.
FIRST GENERATION IS NOT SECOND GENERATION.
#5
Foreign-born often below native average. U.S.-born children of immigrants often rise. Brå: two foreign-born parents ~3.2x raw, highest. ‘Immigrants are safer’ is a first-generation photo used as family history.
The plate contrasts the generations.
SteelMan: Second-generation rates can converge or diverge.
Cut: The plate does not show the U.S. second-generation table.
ORIGIN IS NOT INTERCHANGEABLE.
#6
East Asia, many EU, some other Indian origins are skill streams. U.S. tables are thin. Absence of a U.S. nationality table is not evidence of sameness. Denmark and German PKS print the split. One moral category is a lie. Read origin when it exists.
The plate contrasts thin U.S. tables with European origin tables.
SteelMan: Origin splits exist where they are printed.
Cut: The plate does not show the Danish or German tables.
NATIVE-BORN IS NOT A SINGLE BASE RATE.
#7
Homicide victimization per 100,000. True against the mixed average. CDC 2024. Misleading against White, Asian, or suburban rates. City-core rates higher. Split race and place. The native blob is not the baseline you think.
The plate says the baseline must be split.
SteelMan: Race and place splits change the comparison.
Cut: The plate does not show the CDC numbers.
COUNTS ARE NOT RATES.
#8
Texas DPS raw counts: 335,000+ illegal noncitizens booked. Rates: legal 1.2, illegal 2.2, native 3.0 homicide convictions per 100k. Quoting only one is advocacy. Print both.
The plate requires both counts and rates.
SteelMan: Counts and rates answer different questions.
Cut: The plate does not open the DPS file.
STATUS DATA ARE MISSING IN MOST OF THE COUNTRY.
#9
GAO: states and locals hold ~90% of inmates and do not systematically record citizenship. National illegal-crime rates rest on Texas, a few states, ACS proxies, and an estimated denominator.
The plate identifies the data gap.
SteelMan: Missing status data limits national claims.
Cut: The plate does not show the GAO finding in full.
TIMING AND SELECTION.
#10
2021–2024 wave. Deportation and prison lags years. Incarceration censors some offenders from the stock. The remaining illegal population is not a random sample of everyone who ever entered. Today’s prison table is yesterday’s arrivals, plus whoever was not removed.
The plate notes the lag and the censoring.
SteelMan: Selection by removal changes the measured stock.
Cut: The plate does not show the lag or the removal numbers.
OFFENSE MIX.
#11
Some tails can go the other way. Overall conviction rate lower. Homicide, robbery, sexual offense, property. Less crime is not less of every crime. Older Texas felony cuts: legal immigrants at or above natives on some sex-offense and homicide arrest cells. Read the offense column. The average can hide the tail.
The plate says the average hides offense-specific tails.
SteelMan: Aggregate rates can conceal category-specific elevations.
Cut: The plate does not show the Texas felony cuts.
UNDERREPORTING AND ENFORCEMENT.
#12
Victims may not call. Agencies may not ask status. Sanctuary rules change who hits DHS. Bias can run both directions. Uncertainty is not a license to invert the tables. Missing reports are not the opposite of the printed rates.
The plate limits the inference from missing data.
SteelMan: Underreporting affects levels, not necessarily the direction of a printed gap.
Cut: The plate does not measure the underreporting.
DO NOT IMPORT EUROPE INTO THE U.S. SENTENCE.
#13
Europe: asylum-heavy, Syria, Afghanistan, Maghreb, Horn. United States: labor plus selected skill, Mexico/Central America, East Asia/India. First-gen rates often over-index on violence in Europe and sit below native average in the U.S. Different mixes.
The plate contrasts the origin mixes.
SteelMan: Origin composition differs between the two systems.
Cut: The plate does not show the composition data.
WHAT THE DATA DO NOT SAY.
#14
The data do not say that illegal immigrants are the high-rate group in the U.S. tables cited.
The plate marks a negative claim.
SteelMan: Negative claims require the tables.
Cut: The plate does not show the tables.
WHAT THE DATA DO NOT SAY.
#15
Texas charge and conviction data do not support the slogan’s collapse of status.
The plate points to Texas.
SteelMan: State tables can contradict a national slogan.
Cut: The plate does not open the Texas file.
NOT EVERY NATIONALITY IS BELOW NATIVES.
#16
The data do not say every nationality is below natives.
The plate blocks the universal claim.
SteelMan: Origin variation is the point of the series.
Cut: The plate does not show the nationality splits.
THE SECOND GENERATION DOES NOT STAY LOW.
#17
The data do not say the second generation stays low.
The plate marks the generational limit.
SteelMan: Second-generation convergence is documented in some studies.
Cut: The plate does not show the study.
THEY IDENTIFY THE CAUSES.
#18
The data do not identify the causes: selection, deterrence from deportation, age, work.
The plate lists candidate causes.
SteelMan: A rate difference is not a cause.
Cut: The plate does not test the causes.
A NEW INFLOW WILL NOT LOOK LIKE THE 2010 STOCK.
#19
A new inflow will not look like the 2010 stock.
The plate separates stock from flow.
SteelMan: Composition of arrivals can change.
Cut: The plate does not show the 2010 or current composition.
FOREIGN-BORN, ESPECIALLY LEGAL, HAVE LOWER RATES.
#20
Foreign-born, especially legal immigrants, have lower incarceration and conviction rates in the cited U.S. tables.
The plate states the finding.
SteelMan: The finding is what the better U.S. tables show.
Cut: The plate does not open the tables.
THAT FINDING IS COMPATIBLE WITH.
#21
The finding is compatible with ugly European shares by nationality, high U.S. Black homicide, a second generation that does not stay low, missing national status data, and media saying ‘immigrants’ when the table meant first-generation, mostly legal, averaged across origins.
The plate lists the compatible facts.
SteelMan: Compatibility is not identity.
Cut: The plate does not show each compatible fact.
WHICH COLUMN YOU MAY PRINT.
#22
The argument is which column you may print—legal vs illegal, first vs second generation, Mexico vs Somalia vs China, native White vs native Black—not whether the first-generation U.S. foreign-born column is empty.
The plate locates the dispute in column choice.
SteelMan: Column choice determines the visible comparison.
Cut: The plate does not show a suppressed column.
NOT EVENLY SPREAD.
#23
Black victimization ~21–22 per 100k. White victimization ~3.2–3.5 per 100k. National rate ~6 per 100k.
The plate gives the victimization rates.
SteelMan: The disparity is large and documented.
Cut: The plate does not cite the source table.
COMPARED TO WHICH NATIVES?
#24
Native-born pool includes Black Americans, who are native-born and raise the native average.
The plate says the native average is compositionally raised.
SteelMan: Composition of the baseline changes the gap.
Cut: The plate does not show the decomposition.
CHANGE THE BASELINE, CHANGE THE GAP.
#25
Vs all natives versus vs non-Hispanic White natives. The gap shrinks. Some Latino subgroups: advantage disappears. Cato: excluding Black natives narrows the gap.
The plate shows the baseline sensitivity.
SteelMan: Baseline choice is a real analytic decision.
Cut: The plate does not show the Cato exclusion.
THE WRONG DENOMINATOR.
#26
If the question is this inflow versus the people already there, the national native average is the wrong denominator.
The plate says the denominator must match the question.
SteelMan: Local or subgroup baselines can be the relevant comparison.
Cut: The plate does not specify the correct denominator.
NOT A RANDOM DRAW.
#27
Even when origin rates were high, arrivals are not a random sample of the sending country. Deportation risk selects.
The plate notes selection.
SteelMan: Selection can lower measured rates relative to origin.
Cut: The plate does not show the selection.
NOT HONDURAS WITH A NEW ADDRESS.
#28
Low-education immigrant men are often below similarly educated U.S.-born men. Detention contaminates some incarceration tallies. Census counts and Stanford/Abramitzky-style findings.
The plate cites the education-matched comparison.
SteelMan: Education matching changes the comparison.
Cut: The plate does not open the Abramitzky or Census tables.
NOT EVENLY SPREAD — HISPANIC BAND.
#29
U.S. Hispanic homicide victimization sits between White and Black—above White, far below Black. Approximate CDC/BJS scale.
The plate places the Hispanic rate in the band.
SteelMan: Intermediate rates are still rates.
Cut: The plate does not show the CDC/BJS numbers.
ORIGIN PREDICTS. IT DOES NOT STAMP.
#30
U.S. institutionalization relative to sending-country homicide rate. Foreign-born Hispanic at the low end; U.S.-born Hispanic rates rise. ~2.0x White. Origin matters. It does not copy Tegucigalpa.
The plate separates prediction from copying.
SteelMan: Origin correlation is not identity.
Cut: The plate does not show the CIS-style adjustment.
U.S. CITY-CORE HOMICIDE.
#31
U.S. city-core homicide is a pre-nationality, age-structured pattern. Immigrants and native-born occupy different positions in it.
The plate separates city-core from nationality.
SteelMan: City-core rates have their own drivers.
Cut: The plate does not show the city-core data.
COMPOSITION IS NOT A VIBE.
#32
If group G has rate Rg, raising G’s population share pulls the national rate toward Rg. Second generation versus White/Asian converges up toward baseline. Composition is arithmetic.
The plate states the arithmetic.
SteelMan: Share times rate is the mechanism.
Cut: The plate does not show the shares or rates.
THE SLOGAN HIDES THE NEXT COLUMN.
#33
Sweden relative risk and U.S. Hispanic: highest relative risk in the same direction by generation, not just arrival. First-generation rates are the snapshot the slogan uses. The children are the column it skips.
The plate says the slogan uses the first-generation snapshot.
SteelMan: Generational columns can move in the same direction.
Cut: The plate does not show the Swedish or U.S. generational tables.
WHICH AMERICANS?
#34
The comparison the slogan skips is inflated by Black homicide. The slogan comparison is not the local neighborhood comparison.
The plate distinguishes national and local baselines.
SteelMan: Local baselines can reverse a national gap.
Cut: The plate does not show the local comparison.
SHARE TIMES RATE.
#35
If Rg is above the receiving area’s rate, increasing the share of group G will raise that area’s rate. Second generation is the part to watch.
The plate states the area-level arithmetic.
SteelMan: The arithmetic holds if the rate difference holds.
Cut: The plate does not show an area where the condition is met.
AVERAGES HIDE BOTH TAILS.
#36
Native-born average inflated by Black homicide. Immigrant average deflated by East Asian and some EU/Indian streams. Same flattening. Opposite direction. Do not compare blobs. Split race, origin, legal status, generation.
The plate says both averages conceal tails.
SteelMan: Symmetric warning against both slogans.
Cut: The plate does not show the tails.
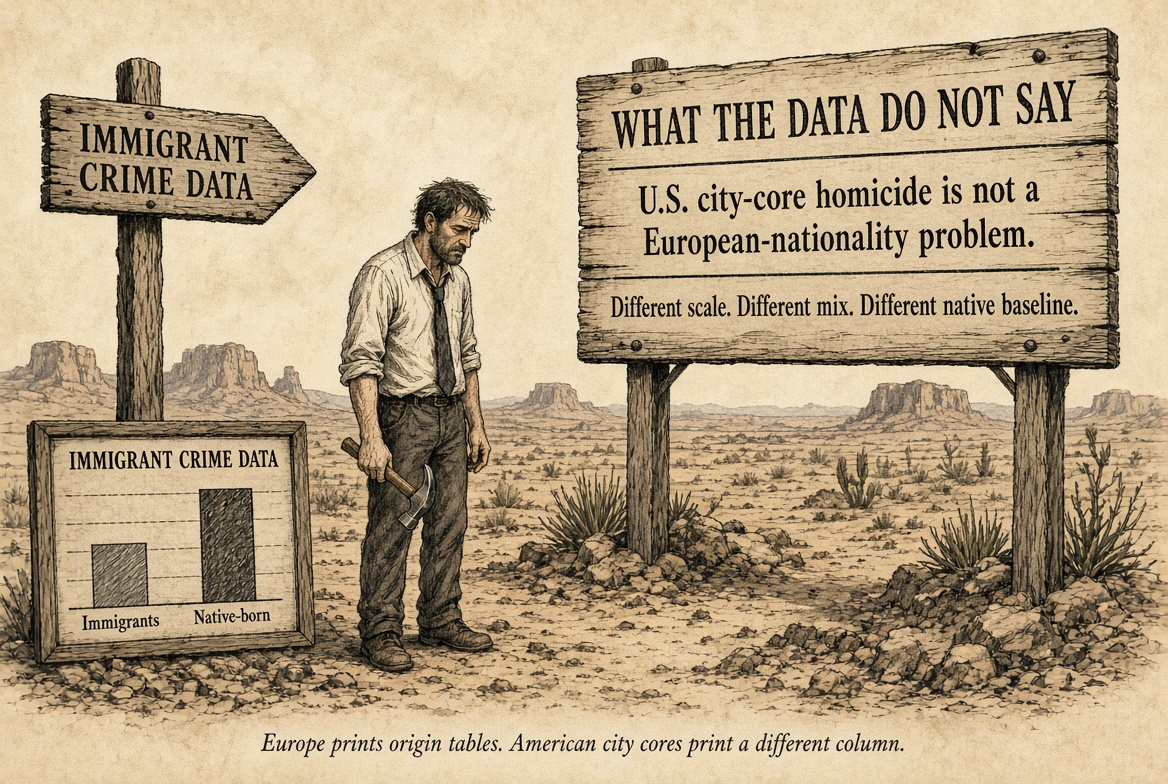
U.S. CITY-CORE HOMICIDE IS NOT A EUROPEAN-NATIONALITY PROBLEM.
#37
Europe prints origin tables. American city cores print a different column.
The plate separates the two printed columns.
SteelMan: Different data regimes produce different visible problems.
Cut: The plate does not show either table.
.jpg)
.jpg)
.jpg)
.jpg)
.jpg)
.jpg)
.jpg)
.jpg)
.jpg)
.jpg)
.jpg)
.jpg)
.jpg)
.jpg)
.jpg)
.jpg)
.jpg)
.jpg)
.jpg)
.jpg)
.jpg)
.jpg)
.jpg)
.jpg)
.jpg)
.jpg)
.jpg)
.jpg)
.jpg)
.jpg)
.jpg)
.jpg)
.jpg)
.jpg)
.jpg)
.jpg)
.jpg)